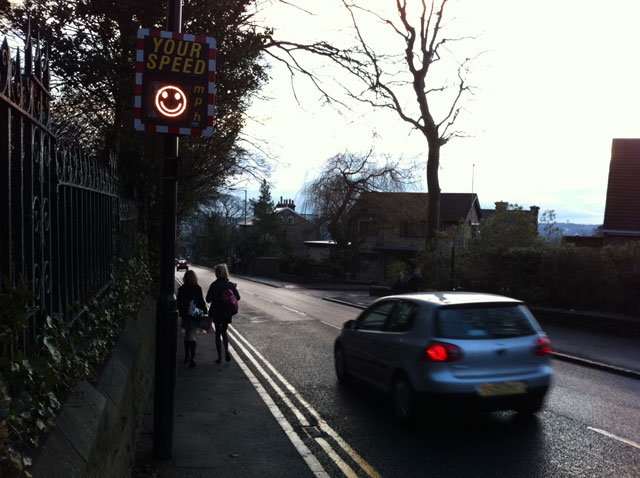
Drivers on the bottom end of Manchester Road will have noticed the electronic speed indication displays (SIDs) return last month. We got in touch the council to find out what data about traffic speeds the SIDs have collected.
The speed limit for this stretch of road is 30mph. The idea is that the SIDs slow cars down by making drivers aware when they are driving at unsafe speeds.
The data below from previous periods when SIDs have been installed on Manchester Road shows a reduction in average speed when they are present:
| Period | Average vehicle speed into town | Average vehicle speed away from town |
| No SIDs on site | 34mph | 31mph |
| February 2011 | 31mph | 29mph |
| July 2010 | 31mph | 27mph |
The SIDs on Manchester Road will be there for an eight-week period before they are rotated to another site by the Central Community Assembly.

Has it been proven that the reduction in average speed is genuinely due to the speed indicators, or is that merely an assumption? The figures you give are meaningless without the variance, and how do we know that it’s not down to congestion or the increasing number/size/depth of potholes?